00: Environment And Library Tour
Sets up the DoWhy environment, introduces the library objects, and uses a compact synthetic decision problem to show how graphs, data, and estimands enter the workflow.
DoWhy is the tutorial track for explicit causal assumptions: model the graph, identify the estimand, estimate the effect, and refute or stress-test the result.
00: Environment And Library Tour
Sets up the DoWhy environment, introduces the library objects, and uses a compact synthetic decision problem to show how graphs, data, and estimands enter the workflow.
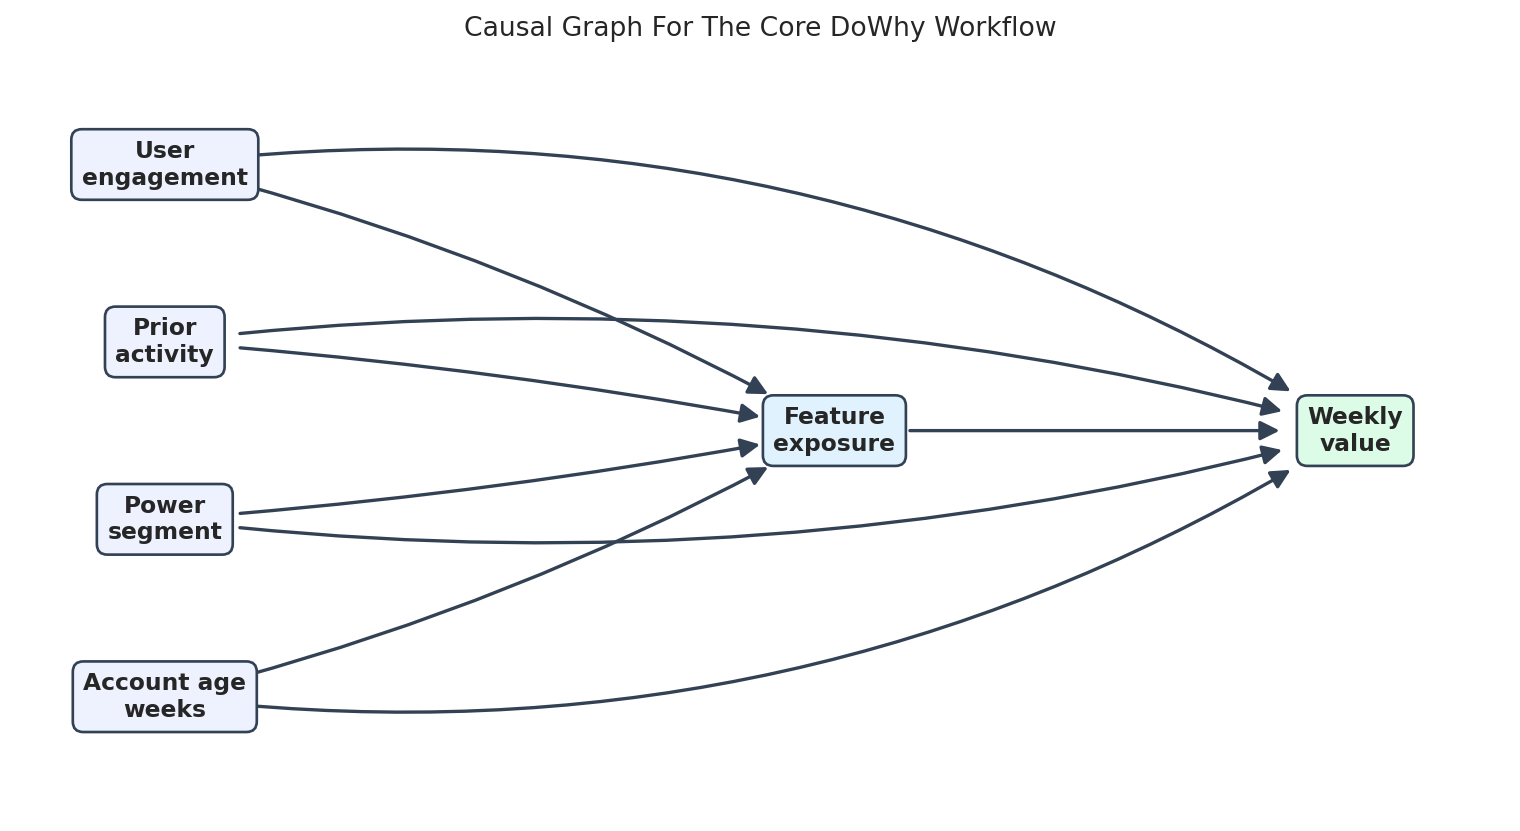
01: Core Workflow, From Question To Refutation
Builds the central DoWhy rhythm: state the causal question, encode assumptions in a graph, identify the estimand, estimate the effect, and run refuters before making a claim.
02: Causal Graphs, DAGs, And Assumptions
Focuses on graph construction, variable roles, adjustment sets, and common DAG mistakes so the package API remains tied to explicit assumptions rather than decoration.
03: Backdoor Adjustment And Confounding
Shows how backdoor adjustment works in DoWhy, why confounding changes treated-control comparisons, and how adjustment choices affect an estimated treatment effect.
04: Regression, Matching, And Propensity Estimators
Compares several estimators for the same estimand, emphasizing what changes across regression adjustment, matching, and propensity-based workflows.
05: Weighting, Overlap, And Common Support
Studies inverse-probability weighting as an implementation and a diagnostic problem, with attention to overlap, weight instability, and whether the target population is credible.
06: Frontdoor, IV, And Natural Experiments
Extends identification beyond simple backdoor adjustment by introducing frontdoor logic, instrumental variables, and quasi-experimental designs in a DoWhy style.
07: CATE And Heterogeneous Effects
Moves from average effects to variation across units, using CATE-style thinking to support targeting, subgroup interpretation, and decision rules.
08: Refuters, Placebos, Negative Controls, And Sensitivity
Treats refutation as a core part of causal reporting, showing how placebo tests, negative controls, and hidden-confounding stress tests can challenge a result.
09: Graph Discovery And Graph Refutation
Uses candidate graph discovery as a source of hypotheses, then shows why discovered structure still needs domain review, constraints, and causal refutation.
10: GCM Structural Causal Models
Introduces DoWhy’s graphical causal model tools for modeling mechanisms, fitting structural relationships, and checking whether the generated world resembles the observed one.
11: Interventions And Counterfactuals With GCM
Uses GCMs to reason about interventions and counterfactual changes, with emphasis on what is being changed, what is held fixed, and how outputs should be interpreted.
12: Mediation, Direct, And Indirect Effects
Breaks an effect into mediated and direct pathways, showing how graph choices and mediator assumptions shape the meaning of a decomposition.
13: Root Cause, Anomaly, And Distribution Change
Connects causal graph reasoning to anomaly attribution and distribution shift, framing root-cause analysis as a structured causal diagnostic problem.
14: End-To-End Observational Case Study
Pulls the workflow together in an observational project, moving from problem setup through graph construction, estimation, diagnostics, sensitivity, and a final summary written for practical decision-making.
15: Common Pitfalls, Debugging, And Reporting
Closes with practical failure modes: bad controls, weak overlap, graph misspecification, fragile estimates, and reporting patterns that make uncertainty visible.